Councils
Local Authorities

Local Authorities
Arboricultural, Ecology and Forestry Services
Farm and Estate Management
Other
Watch this space
Watch this space
Watch this space
Watch this space
How do I register my copy of PearGIS?
When you open PearGIS for the first time, you will need to register the software so that all features will be available to you. To register your copy, go to ‘File’ and then ‘Registration and About’ and make a note of the number shown in the ‘Registration ID’ box.
You will then need to either email us info@peartechnology.co.uk or call us on 02392 499 689 quoting that number and we can provide you with an unlock code.
Licence Type
Perpetual Licence: This is a licence for a specific user to use the software on a single machine. Contact Pear Technology if you want to change either. This licence does not cover regular support and updates.
Subscription Licence: This is a shorter term licence renewable every 365 days and, like the Perpetual Licence, is intended for a single user on a single machine. This licence does cover support and updates.
Trial Licence: The initial install allows the user to evaluate the software for a period of 30 days.
Support and Updates: A separate annual subscription that runs alongside the perpetual licence allowing support and updates. If this licence is not renewed then obtaining the latest version of PearGIS would require a fresh purchase.
Eyes, Padlocks and Chains
Eye : An eye symbol can be seen on the left-hand side of the screen. The eye shows which layers are visible on the map. When the eye has a red cross over it, that layer’s objects will be hidden from view. This can be changed by simply clicking the eye, to change between visible and hidden.
Note : If a layer has been made visible, but the layer objects have not displayed on the screen, this could be because there are other visible layers on top. To resolve this, click here.
Padlock : The padlock is used to prevent layer objects being selected and altered by accident. When locked, the layer objects are not selectable (Red Padlock). Layers can be unlocked (Green Padlock) and locked back up by clicking on the padlock.
Chain : The chain icon shows which layers have been categorised as ‘Reference layers’. These layers are locked down and their features cannot be edited or deleted. Any data that is imported into PearGIS as a ‘Reference Map’ will automatically have a chain applied to it and the layer will need to be duplicated if you wish to edit the imported data.
Selecting an Object
First, make sure the layer your object is on is unlocked (green padlock).
Each type of object must be selected correctly by;
Polygons : Clicking anywhere inside the boundary.
Lines : Clicking anywhere along the length of the line.
Text : Clicking in the middle of the sentence, or word.
To select multiple objects, hold ‘Ctrl’ on your keyboard whilst selecting.
What is the status bar?
This is situated along the bottom of the screen and displays live information related to activity on the screen.

What is the pen/pencil and how do I use it?
The pen indicates which layer is being edited or drawn on. It can be seen next to a layer on the left-hand side of the screen, in the layers tab, when in use.
To add anything to a layer, it must first have the pen next to it.
To move the pen, double-click on the eye or padlock next to the chosen layer. Once finished, the pen can be removed by double-clicking on it, or it can be moved straight onto another layer.
The pen shows clearly which layer an object is going to be moved to, copied to or a new object added to.
Undo and Redo
If changes are made to the map, such as deleting an object, this action an be undone simply by clicking the undo button in the top left corner.
Alternatively if an action is accidentally undone, it can be redone by clicking the redo button in the top left corner.

How do I deselect?
A selected object (see above) can be deselected again by simply right-clicking anywhere on the map.
This is also useful when an action has been completed, (eg. moving a node) and you are satisfied with it, right-clicking completes the action by deselecting the object.
How does layer order work?
 The layers listed in the left-hand column are ordered from top to bottom, as they appear on the map. The top of the list is the layer that is on the top of the map. The sequence of layers is important as the layers at the top can block the view of layers underneath.
It is recommended that text, point and line layers sit towards the top of the layer list, and polygon layers further down the list.
How do I pan around my map?
Or
How do I zoom?
Or
Or
Or
How do I zoom in on a certain area?
Or
How do I view my whole map on the screen? / My screen is white, where is my map?

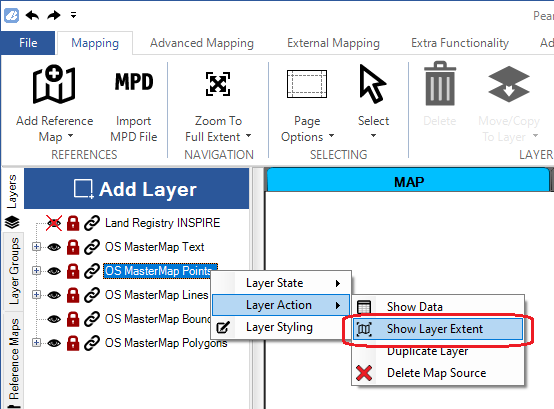
How do I view all objects on one layer at the same time?
How do I add a new layer?
To add a new layer, simply press the ‘Add Layer’ button at the top of the layer list.

What are the different types of layers?
When adding a new layer to your map, you will need to choose what type of layer you wish to add. These are as follows:
| Layer Type | Typical Uses |
| Text | Annotation |
| Point | Trees, Stop Cocks, Hydrants |
| Line | Hedges, Overhead Cables, Footpaths |
| Polygon (Area) | Fields, Properties, Forestry |

Where is my new layer?
How do I move my pencil to a different layer?
Note : Reference layers cannot be edited.
How do I move my layer up and down the layer list?

How do I amend the colour / styling of my layer?

How do I group layers together?
This function enables different layers to be grouped together. Any groups that are created can be found on the far left of the screen, under ‘Layer Groups’.

Note : If a layer has been added to a group, it will have to be removed from that group before it can be added to a new group.

How do I edit a group?
How do I draw?
1. Make sure your pen is next to the layer you wish to draw onto.
Or
2. Create a new layer of your choosing (point, line, text or polygon) and make sure your pen is next to your new layer.
Drawing a line

Note : The line length is visible on the status bar at the bottom of the screen.
Drawing an arrow
![]()
Drawing an area

Note : The area and perimeter are visible on the status bar at the bottom of the screen.
Adding a point

Adding text

How do I add a drawing of a fixed measurement (measured areas)?

Note : This tool is only applicable to polygon (area) or line layers.
How do I edit a layer/access editing options?
Before using the ‘Edit’ tool, you will first need to make sure that you have the layer you wish to edit unlocked, then select the object on the map.
Once selected, there are two ways to edit an object:
1. Press the icon of a pencil in a square (above where it says ‘Edit’).
Or
2. Press the dropdown arrow below the ‘Edit’ button for specific editing tools.

Note : Option 1 is much easier as it gives you most of the editing options at once. However, there are additional editing tools from the dropdown menu.
How do I drag a node / change the shape of a line or area?

How do I move a point or text?

How do I move an object by it’s corner, rather than the middle?

How do I rotate an object?

How do I delete an object?

What is the difference between ‘Moving to a layer’ and ‘Copying to a layer’ ?
Copying an object from one layer to another means you are duplicating it. This will result in a copy of the object appearing on another layer, but it will now appear differently, depending on the particular styling settings in this layer.
Moving an object from one layer to another will remove it from the original layer and place it onto a different one. It will appear differently depending on the specific styling settings in this layer.
How do I copy an object onto a different layer?
Note : The copy may now sit on top of the original. To view the original object, hide the copy by clicking the eye on the new layer.
How do I move an object from one layer to another ?
How do I split an object by drawing a line?

How do I split an object using an existing feature?
How do I remove an area from the middle of another area (remove inner ring)?
How to add a page outline
Before you can print your map, you will need to set up the page outline.
How do I move the page outline?

To move the page, you will firstly need to set up the page outline. If you have not set up a page outline yet, please click here.
How do I print a map?

To print a map, you will need to firstly set up the page outline. If you have not done this yet, please click here.
How do I print a PDF?
PearGIS can print directly to PDF making it easier to share your maps with other. You will firstly need to set up a page outline, click here if you have not already done this.
Most PCs have a default PDF printer already installed called ‘Microsoft print to PDF’ however, this can only print to paper sizes A3 and A4. For larger prints, we recommend using a free PDF printer called ‘PDF Creator’ which can be downloaded from this link https://www.pdfforge.org/pdfcreator/download.
How do I set up a title box?

You can add a title box to any maps in the print preview window.
How do I print an image?
PearGIS can export your map to the following formats : JPEG, BMP, PNG, TIF and GIF.
How do I modify a page outline?
To modify the page, you will firstly need to set up the page outline. If you have not set up a page outline already, please click here.
How do I add a legend to my map?
Legends can be added to any map in the print preview window.
How do I add attribute information to a layer?

Note : If you would like to add field measurements, select one of the ‘Live Attributes’ for the data type and PearGIS will automatically input this information.
How do I add labels using the attribute information?

If the font size needs adjusting after you have closed the Styling Manager, repeat steps 1 and 2 to reopen the label styling settings.
How do I apply an attribute to an object?
How do I add live attributes?
PearGIS can automatically calculate area and length attributes for an object.
The new attribute will be populated with the correct measurement for the object, which will automatically be updated if the object is changed.
How do I style my layer by the attribute values I have entered?
How do I view data in the attribute data tab?
The ‘Attribute Data’ tab will open, displaying a table with the attribute data for the features in the layer. To return to the map, click on the ‘Map’ tab at the top of the window.
How do I sort data in the attribute data tab?

How do I filter data in the attribute data tab?
In the ‘Attribute Data’ tab there is a row below the column header that you can use to filter features in the table.
Selecting ‘(Custom)’ from the drop-down list will open an advanced filter, allowing you to apply a range of criteria.
How do I show selected features on the map via the attribute data tab?
OS requirements
Coming Soon
Why can’t I delete the OS basemap?
Coming Soon
PearOS
Coming Soon
PearMap
Coming Soon
Autosave
Coming Soon
Saving a working version
Coming Soon
Importing OS Mastermap Data
OS Mastermap data can be purchased from our Pear MapShop (If you do not have a MapShop account, please click here register your interest).

Importing OS Raster Tiles
OS Raster tiles can be purchased from Pear Technology (if you would like a quote for OS Raster data, please contact us here). Raster tiles are commonly provided in .TIF or .BMP formats.
Note: Raster data must be georeferenced so that they can be correctly scaled and projected onto the map.
Importing Shapefiles
Shapefiles (.shp) are vector mapping files that contain line and area geometries. This format is compatible with most GIS systems.
Importing CSV Data
An Excel spreadsheet that is saved in a .CSV format can be uploaded into PearGIS.

Importing a DWG or DXF (CAD) file
CAD drawings (DWG or DXF format) can be imported into PearGIS. This method will add features from a CAD drawing to your map permanently, allowing you to edit and style them.

Note: If you’re intending to use the drawing for a GPS survey we strongly recommend you check that the drawing has been georeferenced (drawn in the correct location geographically); if not this will need to be corrected prior to carrying out the survey. This can be done by the surveyor/architect who provided the drawing, alternatively we can offer a georeferencing service for a small charge.
Adding a DWG or DXF (CAD) file as reference map
CAD drawings (DWG or DXF format) can be imported into PearGIS. This method will add your CAD drawing as a reference map; you will not be able to edit any features from the drawing in this format (see ‘Importing a DWG or DXF (CAD) file’ for importing features permanently).
How do I import a map from PT Mapper?
Maps that have been created in PT Mapper can be transferred across to PearGIS.
MPD files can take a few minutes to load and once the import has been completed, the map will appear just like it did in PT Mapper. All of the layers should now appear in the layers list.
How do I export data from PearGIS?
PearGIS can export to the following formats : Shapefile, KML, DXF and Pear Reference Map. When exporting, you can choose to export a few selected features or export entire layers.
If you want to export only a few features (rather than an entire layer), you will first need to select these objects on the map (making sure this layer is unlocked) before starting the export process.

Note: If you are exporting a lot of information, you can select the ‘Compress Output (zip)’ before clicking ‘Create’ and this will save your export into a zip folder.
How do I open up PearGIS features in Google Earth?
Features that have been drawn in PearGIS can be superimposed onto Google Earth. You will need to have Google Earth Pro installed to do this; if you do not have it installed, please use this link – http://www.google.co.uk/earth/download/gep/agree.html

How do I view layer attributes when viewing features in Google Earth?
You can open PearGIS layers in Google Earth by selecting the relevant layers and choosing ‘Google Earth’ from the ribbon; click here if you are unsure of how to do this.
Once the PearGIS features have appeared in Google Earth, click in the middle of the feature to display the attribute information.

How do I copy a feature from Google Earth back into PearGIS?
Drawings created in Google Earth can be copied and pasted into PearGIS.

How do I copy and paste a feature from one map onto another?
Note: A feature can only be copied onto a layer setup with the correct feature type; (Polygons, Lines, Text or Points).

Note: All mapping features have coordinates, therefore they will appear in the exact geographical location as they were in the original map.
How do I copy an entire layer from one map to another?

How do I create a field margin / buffer strip?

Watch this space
Watch this space